
Database Scalling
Shopfiy
- they started off by splitting the primary database into separate parts
- They identified groups of large tables that could exist on separate databases, and used GhostFerry to move a few tables onto a new database.
- This scaling approach is referred to as “federation” where tables are stored in different MySQLs
- As the app further grew, they were starting to hit the limit of a single MySQL.disk size take many Terabytes.y. they couldn’t further split the primary database, as that would add more complexity in the application layer, and require cross database transactions.
- They choose Vitess (Vitess is an open source database system abstraction on top of MySQL that provides many benefits (docs with details) )
Figma
Verticall sharding (April 4, 2023 )
They go with vertically partitionDatabase Partitioning the database by table(s). Instead of splitting each table across many databases, we would move groups of tables onto their own databases. This proved to have both short- and long-term benefits: Vertical partitioning relieves our original database now, while providing a path forward for horizontally sharding subsets of our tables in the future.
They identify which tables can be split by using average active sessions (AAS) for queries, which describes the average number of active threads dedicated to a given query at a certain point in time. We calculated this information by querying pg_stat_activity in 10 millisecond intervals to identify CPU waits associated with a query, and then aggregated the information by table name
They choose the table which will not do joins and required transactions
Migration approach
- Prepare client applications to query from multiple database partitions
- Replicate tables from original database to a new database until replication lag is near 0
- Pause activity on original database
- Wait for databases to synchronize
- Reroute query traffic to the new database
- Resume activity
Note: To fast down the logical replication on they removed the indexing and add the indexing after everythings compeleted
They used Log Sequence Number (it is a unique identifier assigned to each transaction log entry, representing the order in which changes were made to the database. LSNs are used to track the state of replication and determine whether two databases are synchronized.)
They created new Query Routing service will centralize and simplify routing logic as we scale to more partitions.
Horizontal sharding (March 14, 2024)
Our first goal was to shard a relatively simple but very high traffic table in production as soon as possible horizontally sharded groups of related tables into colocations.which shared the same sharding key and physical sharding layout. This provided a friendly abstraction for developers to interact with horizontally sharded tables.
shard key → selected a handful of sharding keys like UserID, FileID, or OrgID. Almost every table at Figma could be sharded using one of these keys.
They group the table in same sharding if they comes under single domain and they have same shard key such that the query will support join and transaction
Example: Imagine Figma has a colo named “UserColo” that includes tables related to user data. Within this colo, there are tables such as “Users”, “UserPreferences”, and “UserActivity”. Each of these tables is sharded based on the UserID, ensuring that data related to a specific user is stored together on the same shard.
Logical Sharding and Physical Sharding
First they did Logical Sharding that involves partitioning or organizing data at the application layer in a way that simulates horizontal sharding without physically distributing the data across multiple shards.
Then after sucess of logical they implement Physical Sharding that involves the actual distribution of data across multiple backend database servers
DBProxy service that intercepts SQL queries generated by our application layer, and dynamically routes queries to various Postgres databases. build with GO
The job is
- A query parser reads SQL sent by the application and transforms it into an Abstract Syntax Tree (AST).
- A logical planner parses the AST and extracts the query type (insert, update, etc) and logical shard IDs from the query plan.
- A physical planner maps the query from logical shard IDs to physical databases. It rewrites queries to execute on the appropriate physical shard.
- if query does not have shard key it will send to all cluster and aggregate the result.
- If they running query that join two table in different shard they will reject it
Notion
check here
- They go with horizontal sharding and application-level sharding.
- Partition block data by workspace ID
- 480 logical shards evenly distributed across 32 physical databases.
Migratio process
- Double-write: Incoming writes get applied to both the old and new databases.
- Backfill: Once double-writing has begun, migrate the old data to the new database.
- Verification: Ensure the integrity of data in the new database.
- Switch-over: Actually switch to the new database. This can be done incrementally, e.g. double-reads, then migrate all reads.
Zerodha
They have only one database no replica set and split the database based on financial year. they doing backup in s3
they using postgres as caching layer where they stored one day of data in this postgres caching layer after one day they drop the database and again move one day data to caching layer. the tool they used is dungbeetle spec : 16core 32GB ram
Learning: we can do wired thing if it work for us :)
Stripe
Stripe’s database infrastructure team built an internal database-as-a-service (DBaaS) offering called DocDB.
How Applications Access DocDB?
DocDB leverages sharding to achieve horizontal scalability for its database infrastructure. With thousands of database shards distributed across Stripe’s product applications, sharding enables efficient data distribution and parallel processing.
Stripe’s database infrastructure team developed a fleet of database proxy servers implemented in Golang. These proxy servers handle the task of routing queries to the correct shard.
When an application sends a query to a database proxy server, it performs the following steps:
- Parsing the query
- Routing it to one or more shards
- Combining the results received from the shards
- Returning the final result to the application
Discord
Discord is a communication platform that started in 2015 and has grown to serve over 29 million daily active users, handling approximately 4 million messages per minute.
Phase 1: MongoDB Era (2015)
Initial Setup:
- Single MongoDB replica set storing all chat messages
- Simple architecture designed for rapid product iteration
- Single compound index on
channel_idandcreated_at
Scale Achieved:
- 100 million messages by November 2015
Breaking Point: The system hit critical limitations when data and indexes could no longer fit in RAM, causing unpredictable latencies. The read/write pattern was approximately 50/50, with extremely random reads—making MongoDB unsuitable for continued growth.
Phase 2: Cassandra Migration (2017)
Why Cassandra? Discord chose Apache Cassandra for three key reasons:
- Horizontal scalability - ability to add nodes seamlessly
- Fault tolerance - distributed architecture with no single point of failure
- Low maintenance - mature replication framework
Architecture Design:
The schema used a composite partition key:
Partition Key: (channel_id, bucket)
Clustering Key: message_id
Where bucket represented a static time window, ensuring all messages for a channel within a given duration resided in the same partition.
Initial Scale:
- 12 Cassandra nodes in 2017
- Billions of messages stored
Growth Trajectory: By early 2022, the system had expanded dramatically:
- 177 Cassandra nodes
- Trillions of messages
- Increasingly unpredictable latency
- Maintenance operations becoming prohibitively expensive
The Hot Partition Crisis
Problem Definition: Hot partitions occur when a specific partition receives disproportionately more traffic than others, causing performance degradation across the entire cluster.
Discord’s Specific Challenge:
When a user posted a message mentioning @everyone in a large channel, it triggered a cascade of issues:
- Thousands of users received notifications simultaneously
- Multiple concurrent read requests hit the same partition (same
channel_idandbucket) - The affected node struggled to serve traffic, falling behind
- Since Discord used quorum consistency level, all queries to nodes serving the hot partition experienced latency increases
Root Causes:
- LSM Tree Architecture: Cassandra uses Log-Structured Merge-tree, making reads more expensive than writes. Hundreds of concurrent reads on a single partition created hotspots
- Expensive Compactions: SSTable compaction operations significantly impacted performance
- Garbage Collection Pauses: Java-based Cassandra experienced GC pauses causing latency spikes up to 40-125ms at p99
Architectural Solution: Data Services Layer
Before migrating databases, Discord implemented an intermediary layer to mitigate hot partition issues.
Data Services Architecture:
Technology Choice: Written in Rust for three critical reasons:
- Performance: C/C++ equivalent performance without compromising safety
- Concurrency: Safe concurrent code without garbage collection issues
- Memory efficiency: Predictable memory usage patterns
Component 1: Request Coalescing
The data services layer sits between the API monolith and database clusters, implementing intelligent request coalescing:
How it works:
- First user request for a message spins up a worker task
- Subsequent identical requests check for existing worker and subscribe to it
- Worker sends a single database query regardless of concurrent requests
- Results broadcast to all subscribed requesters
Impact: Instead of 1,000 concurrent users generating 1,000 database queries for an @everyone mention, the system now sends just 1 query.
Component 2: Consistent Hash-Based Routing
Implemented in the upstream API monolith:
- Uses
channel_idas hash key - Routes all requests for a channel to the same Data Service instance
- Ensures request coalescing works effectively for related messages
Results of Data Services Implementation:
- Significant reduction in hot partition frequency
- Bounded concurrency to hot partitions
- Reduced cascading latency impact
- However, hot partitions still occurred, just less frequently
Phase 3: ScyllaDB Migration (2022)
Why ScyllaDB? ScyllaDB is a Cassandra-compatible database written in C++ that promised to solve Discord’s remaining performance issues:
Key Advantages:
- No Garbage Collection: C++ eliminates Java’s GC pause problems
- Shard-per-Core Architecture: Each CPU core gets dedicated data partition and memory, improving parallelism
- Seastar Framework: C++ async framework with zero-copy networking
- Better Performance: More predictable latency characteristics
Migration Strategy:
Discord initially considered ScyllaDB’s Apache Spark migrator but estimated 3 months for completion. Instead, they built a custom solution:
Custom Rust Migrator:
- Written in Rust for performance and safety
- Used SQLite for checkpointing progress
- Enabled parallel migration streams
- Result: Completed migration in just 9 days
Migration Process:
- Set up ScyllaDB clusters alongside existing Cassandra
- Implement dual-write pattern (writes go to both systems)
- Run custom Rust migrator to backfill historical data
- Validate data consistency across both systems
- Switch reads to ScyllaDB
- Decommission Cassandra clusters
Storage Optimization: Discord also implemented a hybrid-RAID1 architecture using super-disk storage topology on GCP, achieving extremely low latency.
Final Results and Performance Improvements
Infrastructure Reduction:
- Nodes: 177 Cassandra nodes → 72 ScyllaDB nodes (60% reduction)
- Storage: 9TB per node (2x capacity increase)
Latency Improvements:
- Read Latency (p99): 40-125ms → 15ms (73-88% improvement)
- Write Latency (p99): 5-70ms → 5ms (consistent, predictable)
Operational Benefits:
- Eliminated garbage collection-related firefighting
- Linear scalability with core count
- Stable performance during traffic spikes (e.g., World Cup)
- Full CQL compatibility ensured smooth migration
- Unlocked new product use cases due to improved stability
Key Lessons from Discord’s Journey
- Incremental Solutions: Discord didn’t immediately replace Cassandra. They first built the Data Services layer to buy time and reduce impact
- Custom Tooling: Building a custom Rust migrator reduced migration time from 3 months to 9 days
- Language Matters: Switching from Java (Cassandra) to C++ (ScyllaDB) eliminated entire classes of performance problems
- Hot Partition Mitigation: Request coalescing and consistent hashing are architectural patterns that work regardless of underlying database
- Measure Everything: Discord’s detailed latency measurements (p99, not just averages) exposed the true impact of their problems
Netflix
Netflix streams to over 260 million subscribers globally, processing approximately 140 million hours of viewing data per day with a 9:1 write-to-read ratio.
The Challenge: Storing Viewing History at Petabyte Scale
Unlike Discord’s message storage, Netflix’s viewing history has unique characteristics:
- Write-Heavy: 9:1 write-to-read ratio (mostly recording viewing activity)
- Time-Series Nature: Data naturally organized by time
- Uneven Access Patterns: Recent data accessed frequently, older data rarely
- Ever-Growing: Continuous growth with user engagement
Phase 1: Initial Cassandra Architecture
Database Choice: Netflix selected Apache Cassandra for viewing history storage because it excels at:
- Write-Heavy Workloads: Optimized for high write throughput
- Eventual Consistency: Acceptable tradeoff for availability and speed
- Flexible Schema: Column-family model allows growing records without performance degradation
Initial Data Model:
Partitioning Strategy:
Partition Key: CustomerId
Columns: Individual viewing records (title_id, timestamp, duration, etc.)
Each user’s complete viewing history stored in a single Cassandra row, with new viewing events added as columns.
Why This Worked Initially:
- Simple, intuitive design
- Efficient writes (append columns to existing partition)
- Horizontal partitioning by CustomerId distributed load across nodes
Scale Achieved: By 2012, this became one of Netflix’s largest dedicated Cassandra clusters.
Breaking Point: Performance Degradation
As Netflix grew internationally and added features like video previews, the system encountered severe bottlenecks:
Problem 1: SSTable Proliferation
- Cassandra stores data in immutable SSTables on disk
- Growing user histories created increasingly numerous SSTables
- Read operations required scanning multiple SSTables, degrading performance
Problem 2: Expensive Compaction
- Cassandra periodically merges SSTables (compaction) to improve read performance
- With massive data growth, compactions became:
- Extremely time-consuming
- CPU and I/O intensive
- Disruptive to normal operations
Problem 3: Operational Overhead
- Read repairs (ensuring consistency) became expensive
- Full column repairs for wide rows consumed excessive resources
- Maintenance windows stretched longer
Phase 2: EVCache Introduction
Solution: Distributed Caching Layer
Netflix developed EVCache (Ephemeral Volatile Cache), a distributed in-memory key-value store built on Memcached.
EVCache at Scale:
- 200 Memcached clusters
- 22,000 server instances across 4 regions
- Handles 400 million operations per second
- Manages 2 trillion items totaling 14.3 petabytes
- 30 million replication events globally
Architecture:
- SSD-Backed Storage: Despite the “ephemeral” name, EVCache uses SSDs via Memcached’s extstore extension, combining RAM speed with SSD capacity
- Global Replication: Caches replicated across regions for resilience
- Topology-Aware Client: Client understands physical and logical server locations, optimizing data routing
Implementation for Viewing History:
- When user watches content, data written to Cassandra and merged with cached value in EVCache
- Cache stores compressed user viewing history
- On cache miss, fetch from Cassandra, compress, and populate cache
- Achieved cache hit rates above 99.9% for certain services
Benefits:
- Dramatically reduced Cassandra read load
- Sub-10ms response times for cached data
- High availability during regional outages
Optimization: Batch Compression Netflix implemented batch compression for cache replication, reducing bandwidth usage by approximately 35%.
Limitation: While EVCache significantly improved performance, the underlying Cassandra data model still created storage and maintenance challenges as data volume continued growing.
Phase 3: Live vs Compressed Storage Model
Key Insight: Most users access only recent viewing history frequently; older data accessed rarely.
Architectural Redesign:
Netflix split viewing history into two categories with different storage strategies:
1. Live Viewing History (LiveVH)
- Purpose: Store recently watched content
- Format: Uncompressed for fast reads/writes
- Optimization: Designed for real-time updates (pause, resume, continue watching)
- Tuning:
- Frequent compactions to maintain performance
- Low GC grace period for quick outdated record removal
- Frequent read repairs for consistency
- Optimized for speed over storage efficiency
2. Compressed Viewing History (CompressedVH)
- Purpose: Store older viewing records
- Format: Compressed to minimize storage footprint
- Optimization: Prioritizes storage efficiency over access speed
- Tuning:
- Infrequent compactions (data rarely changes)
- Infrequent read repairs (consistency less critical for historical data)
- Aggressive compression reduces storage by approximately 6x
Data Movement: Automated background process migrates data from LiveVH to CompressedVH after a threshold period (e.g., 90 days).
Results:
- ~6X reduction in data size
- ~13X reduction in system time spent on maintenance
- ~5X reduction in average read latency
- ~1.5X reduction in average write latency
- Provided headroom for rapid business growth
Phase 4: Advanced Sharding by Age and Type
As Netflix introduced video previews, multi-language support, and original content production, the team implemented even more sophisticated sharding.
Sharding Strategy 1: Age-Based Clusters
Cluster Architecture:
-
Recent Cluster: Last few days of viewing data
- Optimized for extremely low latency
- Highest resource allocation
- Most frequent access patterns
-
Past Cluster: Few weeks to months of viewing data
- Balanced optimization between speed and storage
- Medium resource allocation
-
Historical Cluster: Older viewing data
- Optimized for storage efficiency
- Compressed and summarized data
- Rare access patterns
Data Rotation Pipeline: Automated background service orchestrates movement:
- Recent → Past: After data exceeds recency threshold
- Past → Historical: Data summarized, compressed, moved to long-term storage
- Parallel writes and chunking prevent slowdowns during movement
Sharding Strategy 2: Data Type Sharding
Netflix further segmented storage by data type:
1. Full Title Plays
- Complete episodes/movies watched
- High-quality signal for recommendations
- Stored uncompressed in Recent cluster
- Moved to compressed storage over time
2. Video Previews
- Short preview plays (often seconds)
- Filtered: Previews under certain duration threshold not stored
- Reduces noise in recommendation signals
- Separate retention policies
3. Language Preferences
- Subtitle and audio track selections
- Previously duplicated across viewing records
- Optimization: Store once per user, record only deltas (changes)
- Massive storage savings for international users
Handling Large Viewing Histories: Chunking
Problem: Some power users had extremely large viewing histories. Reading/writing single massive compressed files became inefficient.
Solution: Chunking Architecture
How It Works:
- Metadata Storage: Store version and chunk count
- Write Process: Split large compressed data into chunks, write separately, track via metadata
- Read Process:
- Read metadata first
- Fetch chunks in parallel
- Reconstruct complete history
Benefits:
- Distributes load across multiple Cassandra nodes
- Parallel reads significantly improve retrieval speed
- Prevents single-partition bottlenecks
- Scales to arbitrarily large histories
Phase 5: Advanced Optimizations
1. Intelligent Filtering
Preview Filtering: Many previews watched for only a few seconds don’t indicate genuine interest. Netflix implemented pre-write filtering to avoid storing low-quality signals.
Language Preference Delta Storage: Instead of storing language preferences with every viewing record, Netflix stores one baseline and only records changes, eliminating massive data duplication.
TTL-Based Expiration: Implemented Time-To-Live policies to automatically delete unneeded records after defined periods, preventing database bloat.
2. Optimized Data Retrieval
Targeted Queries:
- Recent data requests → Recent Cluster (low latency)
- Historical requests → Parallel reads across Past and Historical clusters
- Intelligent stitching combines results from multiple sources
Parallel Query Execution: When fetching complete viewing history, Netflix queries multiple clusters simultaneously, dramatically improving response times.
3. Summary Cache with 99% Hit Rate
Innovation: Netflix restructured EVCache to mirror backend storage architecture:
- Summary Cache Cluster: Stores precomputed viewing summaries
- Computation: Nightly batch jobs generate summaries for all users
- Access Pattern: Nearly all requests served from cache
Results:
- 99% cache hit rate achieved
- Minimal Cassandra load for summary requests
- Sub-millisecond response times for most users
Database Technologies at Netflix
Beyond Cassandra, Netflix’s evolution included adopting additional databases for specific use cases:
CockroachDB Adoption (2019): Netflix adopted CockroachDB for use cases requiring:
- Global consistent transactions
- Multi-active topology
- Rich secondary indices
- SQL capabilities
Use Cases:
- Cloud drive service (file system for media assets)
- Content delivery control plane (managing CDN devices)
- Spinnaker continuous delivery platform
Why Not Cassandra for These? Cassandra’s lightweight transactions and unreliable secondary indices couldn’t support the consistency requirements.
Final Architecture: Netflix Viewing Data Platform
Current State (2025):
- Multiple Cassandra Clusters: Dozens of clusters with hundreds of nodes each
- Sharding: By age (Recent/Past/Historical) and type (Plays/Previews/Preferences)
- EVCache: Petabyte-scale distributed caching with global replication
- Hybrid Model: Live and compressed storage patterns
- Automated Management: Data rotation, chunking, compression all automated
Scale Metrics:
- 140+ million hours of viewing per day
- Petabytes of daily data ingestion
- Hundreds of thousands of peak writes per second
- Single-digit millisecond read latency
- 99.99%+ availability
- Global deployment across multiple data centers
Key Lessons from Netflix’s Journey
-
Access Pattern Awareness: Separating hot (recent) and cold (historical) data with different optimization strategies yielded massive gains
-
Iterative Evolution: Netflix didn’t jump to the final architecture. Each phase solved current problems while enabling future growth
-
Caching is Critical: EVCache became as important as the database itself, handling 99%+ of requests at massive scale
-
Data Modeling Matters: How you store data (compressed vs uncompressed, chunked vs monolithic) dramatically impacts performance
-
Automation is Essential: Automated data movement, rotation, and lifecycle management prevents operational overhead from scaling linearly with data
-
Multi-Database Strategy: Netflix recognized that no single database fits all use cases, adopting CockroachDB for consistency-critical applications
-
Compression ROI: Achieved 6x storage reduction with compression, but only for cold data where access speed tradeoff is acceptable
-
Measure and Monitor: Netflix’s detailed metrics and monitoring enabled data-driven decisions about when and how to evolve
Caching
DoorDash’s
They use Layered caches
- Request local cache: Lives only for the lifetime of the request; uses a simple HashMap.
- Local cache: Visible to all workers within a single Java virtual machine; uses a Caffeine cache for heavy lifting.
- Redis cache: Visible to all pods sharing the same Redis cluster; uses Lettuce client.
They have Runtime feature flag control to enable and disable the caching in layer
Cache invalidation
- Using Change Data Capture events emitted when database tables are updated
- The cache could be invalidated directly within the application code when data changes. This is faster but potentially more complex
Cache key how they create unique cache key
- Unique cache name, which is used as a reference in runtime controls.
- Cache key type, a string representing the key’s type of entity to allow categorization of cache keys.
- ID, a string that refers to some unique entity of cache key type.
- Configuration, which includes default TTLs and a Kotlin serializer.
To standardize key schema, we chose the uniform resource name (URN) format:
urn:doordash:<cache key type>:<id>#<cache name>Uber
They using Docstore (distributed database built on top of MySQL) database where they want to implement caching in query engine layer to optimize the db so let see how they did
Docstore
Docstore is mainly divided into three layers: a stateless query engine layer, a stateful storage engine layer, and a control plane.
The stateless query engine layer is responsible for query planning, routing, sharding, schema management, node health monitoring, request parsing, validation, and AuthN/AuthZ. (they plan to build cache on front of stateless query engine)
The storage engine layer is responsible for consensus via Raft, replication, transactions, concurrency control, and load management. A partition is typically composed of MySQL nodes backed by NVMe SSDs, which are capable of handling heavy read and write workloads. Additionally, data is sharded across multiple partitions containing one leader and two follower nodes using Raft for consensus.
CacheFront
Since Docstore’s query engine layer is responsible for serving reads and writes to clients, it is well suited to integrate the caching layer. It also decouples the cache from disk-based storage, allowing us to scale either of them independently. The query engine layer implements an interface to Redis for storing cached data along with a mechanism to invalidate cached entries
CacheFront uses a cache aside strategy to implement cached reads:
- Query engine layer gets read request for one more rows
- If caching is enabled, try getting rows from Redis; stream response to users
- Retrieve remaining rows (if any) from the storage engine
- Asynchronously populate Redis with the remaining rows
- Stream remaining rows to users
Cache Invalidation
They used Change Data Capture for Cache Invalidation they have publisher which will publishes the events for each update in DB and they have consumer which will listen for the changes and do invalidation in Cache
Cache key
They used below format
RK{<tablename} | <PARTIONkEY>| <ROWKEY>|<INSTANCE>}
Cache Warming
A Docstore instance spawns two different geographical regions to ensure high availability and fault tolerance. they both have two seprate redis in there region In case of a region failover, another region must be able to serve all requests.
If we have two region we need to sync db and cache data among the region such that if one region get down we will get data from other region but the problem is for the Docstore has its own cross-region replication mechanism. If we replicate the cache content using Redis cross-region replication, we will have two independent replication mechanisms, which could lead to cache vs. storage engine inconsistency
So to solve this they tail the Redis write stream and replicate keys to the remote region. In the remote region instead of directly updating the remote cache, read requests are issued to the query engine layer which, upon a cache miss, reads from the database and writes to the cache such that now both region have same consistent data.
Circuit Breakers
If a Redis node goes down, we’d like to be able to short circuit requests to that node to avoid the unnecessary latency penalty of a Redis get/set request
To achieve this, we use a sliding window circuit breaker. We count the number of errors on each node per time bucket and compute the number of errors in the sliding window width.
Avoiding DB overload on cache down: let say the redis node is down then suddenly all request will forward to DB. db will be overloaded to avoid that they dynamically adjust the db timeout of the query
How Meta Achieves 99.99999999% Cache Consistency:
common race condition for inconsistency:
- The client queries the cache for a value not present in it
- So the cache queries the database for the value: x = 0
- In the meantime, the value in the database gets changed: x = 1
- But the cache invalidation event reaches the cache first: x = 1
- Then the value from cache fill reaches the cache: x = 0
To solve this they created observability solution.
Monitoring They created a separate service to monitor cache inconsistency & called it Polaris
- It acts like a cache server & receives cache invalidation events
- Then it queries cache servers to find data inconsistency
- It queues inconsistent cache servers & checks again later
- It checks data correctness during writes, so finding cache inconsistency is faster
- Simply put, it measures cache inconsistency
- Polaris queries the database at timescales of 1, 5, or 10 minutes. It lets them back off efficiently & improve accuracy.
Tracing
- It logs only data changes that occur during the race condition time window. Thus log storage becomes cheaper
- It keeps an index of recently modified data to determine if the next data change must be logged
- Polaris reads logs if cache inconsistency is found & then sends notifications
Netflix
Netflix serves 260+ million subscribers globally, processing approximately 140 million hours of viewing data per day. The streaming platform must deliver personalized content recommendations, viewing history, and metadata to users with sub-100ms latency across regions.
The Caching Challenge at Netflix Scale
Netflix’s caching requirements are fundamentally different from most systems:
- Data Volume: Stores petabytes of cached data (2+ trillion items, 14.3 petabytes total)
- Global Distribution: Must serve users in 4+ regions with consistent low latency
- Diverse Data Types: Personalization, viewing history, metadata, session state, UI strings, translations
- Multiple Access Patterns: Hot data (personalization) accessed constantly, cold data (historical viewing) rarely
- Cost Pressure: At petabyte scale, even small per-unit savings multiply into millions annually
EVCache: The Custom Caching Infrastructure
Netflix built EVCache (Ephemeral Volatile Cache) starting in 2013 as a distribution, replicated caching layer built on Memcached with Netflix-specific enhancements.
Why Custom vs Off-the-Shelf?
- Standard Memcached had no built-in global replication
- AWS-specific optimizations needed for topology awareness
- Required seamless deployments without data loss
- Needed support for automatic failover across Availability Zones
- Linear scalability required for petabyte scale
EVCache at Scale: Current Infrastructure
Deployment:
- 200 Memcached clusters (each cluster dedicated to specific use case: personalization, metadata, etc.)
- 22,000 server instances globally
- 2 trillion cached items total
- 14.3 petabytes of total cached data
- 400 million operations per second sustained throughput
- 30 million replication events per second across 4 global regions
Four Distinct Use Cases
Netflix strategically deploys EVCache differently depending on data characteristics:
Use Case 1: Lookaside Cache (Reducing Database Load)
Cache popular queries to eliminate database overhead:
- Example: User recommendations (computed nightly)
- Process: Batch job generates personalized recommendations → writes to EVCache → users read from cache
- Hit Ratio: 99%+
- TTL: 24 hours (refreshed daily with new recommendations)
- Database Benefit: Eliminates ~140 million+ database queries per day
Use Case 2: Transient Data Store (Session Management)
Cache temporary, multi-service state without database:
- Example: Cross-device playback sessions
- Data Structure:
{user_id, device, video_id, current_position, timestamp} - Lifecycle: User pauses on phone → switches to TV → session updates → user finishes (session expires)
- TTL: 30 minutes (auto-deletes on inactivity)
- Benefit: Enables instant resume across devices without database overhead
Use Case 3: Primary Store (Pre-Computed Personalization)
Store pre-computed, computationally expensive data directly in cache:
Netflix Homepage Personalization Pipeline:
Daily Pre-Computation (Batch Job):
  ├─ Analyze 260M+ users' watch histories
  ├─ Run personalization ML algorithms (hours of compute)
  ├─ Generate 260M+ unique homepage layouts
  ├─ Select top 5 recommendations per user
  ├─ Generate thumbnail preview images
  └─ Write entire pre-computed homepage to EVCache

When User Launches App:
  ├─ Query EVCache for user's homepage (< 1ms)
  ├─ Homepage retrieved ready to render
  ├─ User sees personalized content instantly
  └─ No compute required on request path
Why Cache vs Database?
- Data Volume: 260M+ unique homepages (can’t store all in database economically)
- Access Pattern: Almost 100% cache hit rate
- Compute Deferment: All expensive computation happens offline
- User Experience: Instant load on app open (critical for retention)
Use Case 4: High-Volume, Always-Available Data (UI Localization)
Cache critical infrastructure data needed for every app load:
Netflix UI Strings Example:
Localization Data (all languages/regions):
  ├─ "Watch Now" button (10+ languages)
  ├─ "Add to My List" (10+ languages)
  ├─ Pricing information (20+ countries)
  ├─ Help text (12+ languages)
  ├─ Error messages (10+ languages)
  └─ Age ratings by country
Caching Strategy:
- Asynchronous process runs every 30 minutes
- Fetches localization from database, applies regional customizations
- Writes to EVCache with 1-hour TTL
- Users never query database directly for UI strings
- Cache hit rate: 98%+
EVCache Evolution: RAM to SSD-Backed Hybrid Storage (2016)
The Problem: As Netflix grew, caching costs became prohibitive
Original Architecture (2013-2015): Pure in-memory RAM
- Netflix personalization data: 5 terabytes and growing
- r3 instances: 245 GB RAM each
- To cache 5 TB: Required ~21 expensive r3.xlarge instances
- Monthly cost: ~$31,500+ just for one cache cluster
Cost Crisis: Netflix would need tens of thousands of instances to cache all personalization globally
Solution: Memcached External Storage (extstore) - 2016
Netflix adopted Memcached extstore, an extension allowing Memcached to offload data to NVMe SSDs:
Two-Level Storage Architecture:
Tier 1: RAM (Ultra-Hot Cache)
- Purpose: Store frequently accessed data and all metadata
- Latency: < 1 microsecond
- Capacity per node: 64-128 GB
- Data Stored: Recent recommendations, active sessions, hot personalization
Tier 2: NVMe SSD (Warm Cache)
- Purpose: Store less frequently accessed data
- Latency: 5-20 microseconds (still very fast)
- Capacity per node: 800 GB (12x increase!)
- Data Stored: Historical personalization, older recommendations, cold data
Access Pattern:
Request for cached item:
  ├─ Check RAM for key metadata (1-2 µs)
  ├─ Value in RAM?
  │  ├─ Yes → Return immediately (< 1 µs)
  │  └─ No → Check SSD
  ├─ Value in SSD? → Fetch (10-20 µs)
  └─ If access frequency high → Promote from SSD to RAM on next access
Cost and Performance Benefits
Before extstore (Pure RAM):
- Storage per node: 245 GB
- For 5 TB: 21 nodes needed
- Cost per month: ~$31,500
- Cost per petabyte: ~$6.3 million/month
After extstore (RAM + NVMe):
- Storage per node: 64 GB (RAM) + 800 GB (SSD) = 864 GB
- For 5 TB: 6-7 nodes needed (66% reduction)
- Cost per month: ~$14,000 (55% reduction)
- Cost per petabyte: ~$2.8 million/month
Additional Benefits:
- 3.5x increase in data density per node
- Latency still < 100ms even for SSD-resident data
- Capacity scaled from 245 GB to 800+ GB per node
- Enabled Netflix to cache all personalization globally at acceptable cost
Global Replication: Asynchronous Cross-Region Consistency
Netflix replicates cache data across 4 AWS regions to ensure users get low-latency access from their nearest region:
Asynchronous Replication Flow:
Step 1: Write in Primary Region (US-East)
Application: EVCache.set(
  key="homepage:user:123456",
  value=homepage_json,
  ttl=86400  # 24 hours
)
Step 2: Local Cache Write + Metadata Event
EVCache Node (US-East):
  ├─ Write key-value locally
  ├─ Asynchronously emit to Kafka:
  │  ├─ key: "homepage:user:123456"
  │  ├─ ttl: 86400
  │  ├─ created_at: timestamp
  │  └─ region: "us-east-1"
  └─ (Note: VALUE not included in event)
Critical Design Decision: Why only metadata, not value?
Netflix discovered transmitting only metadata provides massive benefits:
- Network Efficiency: Values (JSON homepages) can be 100+ KB; metadata is < 1 KB
- Bandwidth Savings: 10-20x reduction in cross-region traffic
- Optimization: Eliminate duplicate transmission (write + replication)
- Ordering: Metadata preserves operation sequence for consistency
Step 3: Replication Reader Processes Event
Replication Reader (runs in US-East):
  ├─ Consumes Kafka metadata event
  ├─ Issues LOCAL read: EVCache.get("homepage:user:123456")
  ├─ Gets current value from local cache
  └─ Sends to Replication Writers in other regions
Step 4: Cross-Region Write
Replication Writer (EU-West region):
  ├─ Receives key + value + metadata
  ├─ Calls: EVCache.set(key, value, ttl)
  └─ Homepage now available in EU cache
Step 5: User Access from Europe
When user in Europe launches app:
  ├─ Query EU EVCache
  ├─ Cache hit (data replicated) → < 1ms response
  └─ User sees instant personalized homepage
Replication Characteristics:
- Scale: 30 million replication events per second
- Cross-Region Latency: 100-500ms
- Consistency: Eventually consistent (not strong consistency)
- Acceptability: Acceptable because personalization refreshed daily
- Fault Tolerance: Local cache survives region failures; replication catches up when link recovers
Cache Warming: Scaling EVCache Clusters
Original Problem: Scaling cache clusters required days
Old Process:
- Deploy new empty cache cluster
- Dual-write to both old and new cluster
- Wait for old cluster’s TTL to expire (could be 3-14 days)
- Only then switch traffic to new cluster
- Total time: 1-2 weeks per scaling operation
New Process: Direct Replica Snapshot
Netflix developed cache warming to populate new clusters instantly:
Source Cluster (Full):
  ├─ Node 1: 500 GB personalization data
  ├─ Node 2: 500 GB personalization data
  └─ Node 3: 500 GB personalization data

Target Cluster (being scaled):
  ├─ Node 1: Snapshot of Source Node 1 (instant)
  ├─ Node 2: Snapshot of Source Node 2 (instant)
  └─ Node 3: Snapshot of Source Node 3 (instant)

Result: New cluster fully populated in minutes
Mechanism:
- Memcached supports snapshots/backups
- Restore snapshots directly to new nodes
- Completely bypasses waiting for TTL expiration
Benefits:
- Scale clusters in minutes instead of days
- Respond to traffic spikes with pre-warmed cache
- Add capacity for new features immediately
- Enable more agile deployments
Resources
- https://blog.bytebytego.com/p/how-netflix-stores-140-million-hours
- https://www.linkedin.com/posts/nilesh-bhosale-044272148_redis-memcached-caching-activity-7385200464524480512-Cay7/
Logging
Search
To achieve stability and scalability, they used Open Distro for Elasticsearch, but added a proxy and two services: Ingestion Service and Backfill Service.
The proxy separates read and write traffic from clients, handles client authentication, and provides additional metrics and flexible routing and throttling. This design creates a single entry point for all requests and makes it easier for customers to build solutions.
The Ingestion Service was introduced to handle large traffic spikes. It queues requests from clients into a Kafka topic, and worker clients then send the requests to the Elasticsearch cluster. The service batches requests, listens to back-pressure, auto-throttles, and retries with backoff, smoothing out traffic to the cluster and preventing overload.
Real time coloboration
Canva
Canva’s initial implementation of real-time mouse pointers relied on a backend-centric architecture using websockets and Redis. Here’s a simplified explanation with an example:
Imagine three users, Alice, Bob, and Charlie, are collaborating on a Canva design.
- Connection: Each user connects to a specific Canva server instance (let’s call them Instance 1, Instance 2, and Instance 3) via a websocket.
- Session Information: When a user connects, the server records which instance they are connected to. This information is stored in Redis, acting as a shared memory for all server instances. For example, Redis will store:
- Alice - Instance 1
- Bob - Instance 2
- Charlie - Instance 3
- Mouse Movement: Let’s say Alice moves her mouse. Her browser sends the updated mouse position to Instance 1 via the websocket.
- Data Broadcast: Instance 1 checks the session information in Redis to see which instances Bob and Charlie are connected to.
- Targeted Sending: Instance 1 then sends Alice’s mouse position data only to Instance 2 and Instance 3, ensuring targeted delivery.
- Update Display: Instances 2 and 3, upon receiving the data, update Bob and Charlie’s screens, respectively, showing Alice’s mouse pointer movement.
This system allowed Canva to scale real-time collaboration features to a large number of users. However, to achieve even higher update rates and reduce latency, they later transitioned to a WebRTC-based architecture, enabling direct peer-to-peer communication between clients.
Canva’s second iteration of the real-time mouse pointer feature uses WebRTC, a technology designed for real-time communication in web browsers. This approach shifts from a server-centric model to a peer-to-peer connection, enabling direct data exchange between clients with minimal server involvement. Here’s how it works with an example:
Let’s consider the same scenario: Alice, Bob, and Charlie are collaborating on a design.
- Connection Establishment:
- When Alice joins, her browser initiates contact with a signaling server. Canva uses its existing infrastructure from the first system for this purpose.
- The signaling server helps establish connections but doesn’t handle the mouse pointer data itself.
- Alice’s browser also gathers ICE candidates representing potential connection routes, including direct connections and connections relayed through a TURN server.
- Offer and Answer:
- Alice’s browser sends an offer SDP (Session Description Protocol) to Bob and Charlie via the signaling server. This offer contains information about the session and codecs.
- Bob and Charlie, upon receiving the offer, respond with an answer SDP, also relayed through the signaling server.
- They simultaneously gather their own ICE candidates and exchange them with Alice via the signaling server.
- Connection Formation:
- Each user’s browser analyzes the received ICE candidates and prioritizes them based on factors like connection type (direct or relayed).
- The browsers attempt to establish a peer-to-peer connection using the best candidate pair.
- If a direct connection is not feasible (e.g., due to firewalls or NAT), the connection is relayed through a TURN server.
- Data Channel:
- Once the connection is established, a data channel is opened over the connection. This channel allows the transmission of mouse pointer data in a chosen format (string or binary).
- Real-time Updates:
- When Alice moves her mouse, her browser sends the updated position information directly to Bob and Charlie through the established data channels, bypassing the need to go through a central server.
- Bob and Charlie’s browsers receive this data and update their screens to reflect Alice’s mouse movements in real time.
Scaling websocket
To achieve near-zero downtime during deployments, Compose follows these steps:
- New servers are spun up and become healthy.
- Old servers return 503 responses, causing the load balancer to remove them after 25 seconds.
- Old servers send a custom WebSocket close message to clients, asking them to reconnect with a random delay to avoid a surge.
- Clients use exponential backoff for reconnections to handle potential issues.
- Once all clients disconnect, the old servers shut down.
At Compose, WebSocket messages are organized using a custom 2-byte type prefix to categorize each message, allowing up to 65,536 message types. This is space-efficient and ensures reliable message parsing.
A delimiter (|) separates fields inside the message, making encoding/decoding faster and more memory-efficient than using JSON. By using TypeScript on both backend and frontend, message schemas are easily shared, preventing version mismatches.
Example TypeScript code:
const MESSAGE_TYPE_TO_HEADER = {
  RENDER_UI: "aa",
  UPDATE_UI: "ab",
  SHOW_LOADING: "ac",
  RENDER_UI_V2: "ad",
  // ...
}

const DELIMITER = "|";

function createDelimitedMessage(type: string, args: any[]) {
  return [MESSAGE_TYPE_TO_HEADER[type], ...args].join(DELIMITER);
}

function parseDelimitedMessage(message: string) {
  const [type, ...args] = message.split(DELIMITER);
  return { type, args };
}
This approach allows easy API upgrades with versioned message types.
Trello realitime updated
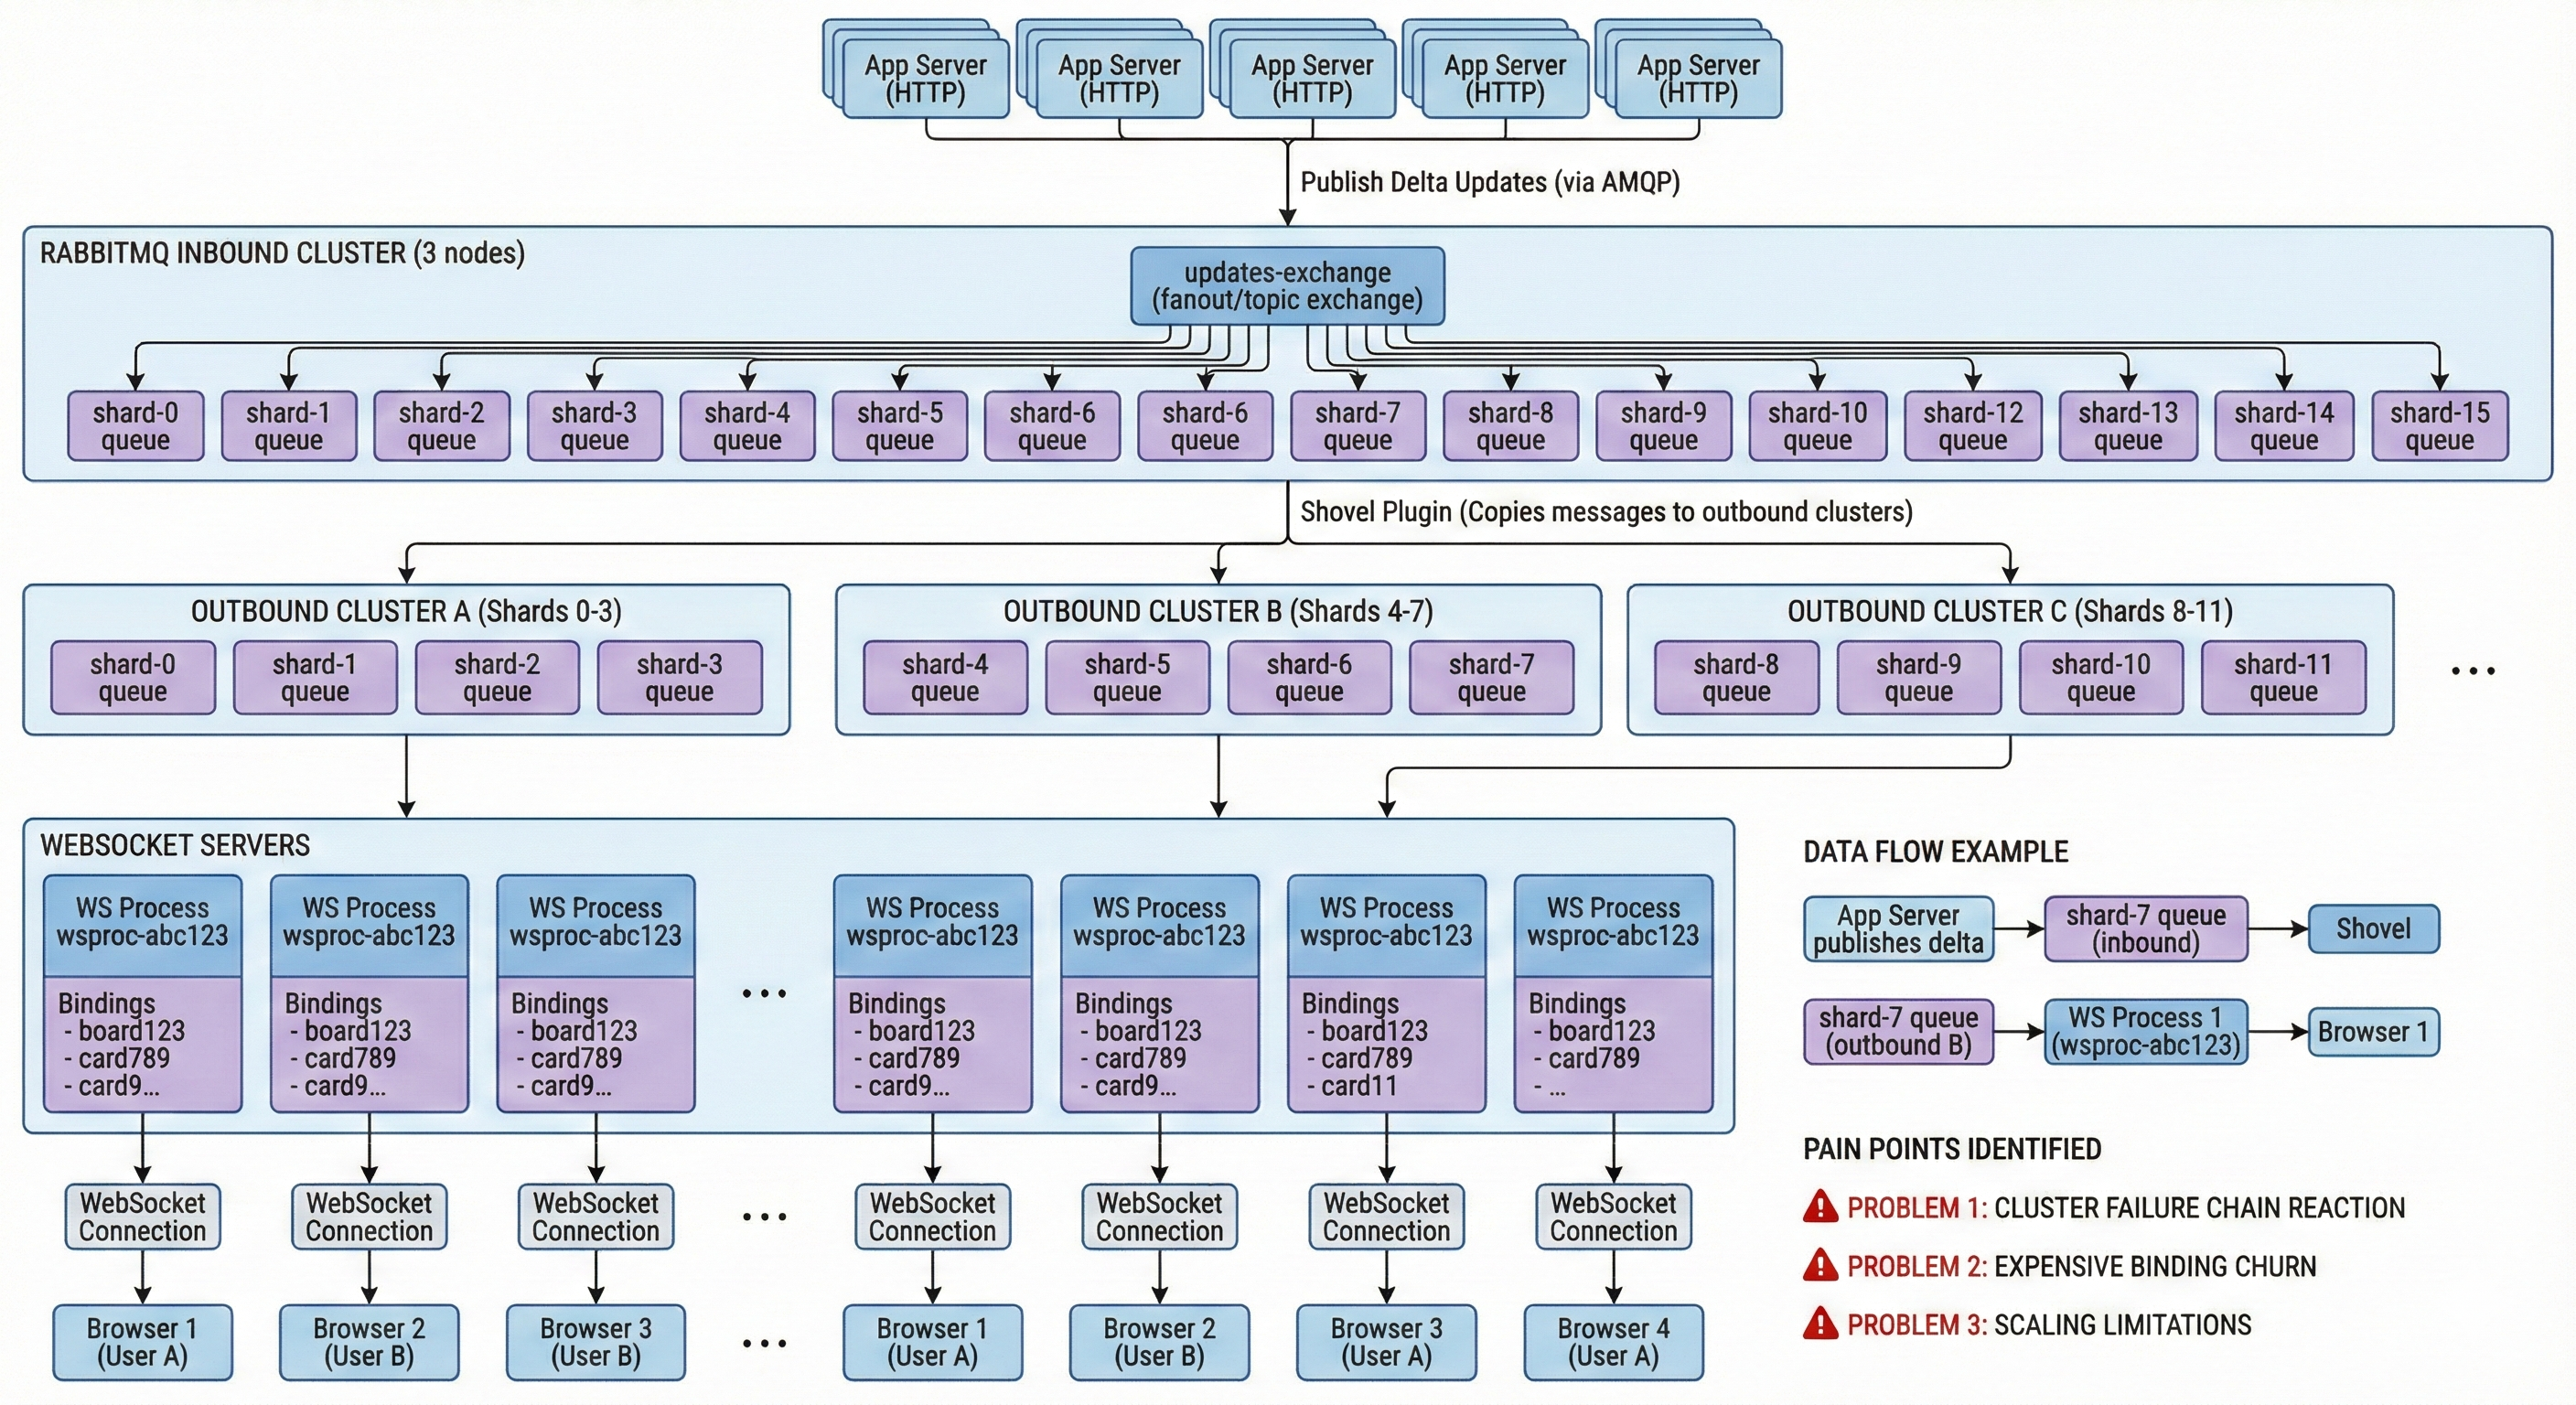
-
User moves Card “card456” on Board “board123” → App Server publishes delta to RabbitMQ inbound → Routing key: shard-7 (computed from “card456” ID)
-
Message lands in shard-7 queue on inbound cluster → Shovel copies to outbound cluster B (handles shards 4-7) → Lands in shard-7 queue on cluster B
-
WebSocket Process 1 has:
- Transient queue wsproc-abc123
- Binding to shard-7 for board123 (created when User A subscribed) → Message routed to wsproc-abc123
-
WebSocket Process 1:
- Reads message from wsproc-abc123
- Forwards to Browser 1 via WebSocket connection → User sees card move in real-time
Issue they face
RabbitMQ’s behavior under network partitions and failures was problematic for them:
- Could have split-brain or full cluster failure.
- Recovery often required resetting the cluster.
- Resetting can mean:
- All WebSocket connections reset.
- Clients must reconnect and resubscribe.
- Potentially missing messages or having them delivered out of order with no easy way to reconcile.
So operationally:
- Network blip → RabbitMQ cluster freaks out → reset cluster → drop all sockets → reconnect storm.
Cost of creating/destroying queues and bindings
Their strategy involves:
- A transient queue per WebSocket process.
- Potentially many bindings per process, across many outbound clusters.
Problems:
- Creating queues and bindings is slow and expensive in RabbitMQ.
- Destroying them is also expensive.
- When a WebSocket server dies or restarts:
- All its connections drop.
- Clients reconnect (sometimes all at once).
- Each reconnect triggers a burst of:
- “Create transient queue”
- “Add thousands of bindings”
- This creates:
- A massive subscribe/unsubscribe storm.
- RabbitMQ can become unresponsive, even to monitoring or shutdown signals.
- Sometimes this pushes the cluster into another failure state.
They tried to mitigate:
- Introduced jitter when reconnecting to avoid stampedes.
- But network partitions and cluster behavior remained a major issue.
So they migrated kafka
- https://www.perplexity.ai/search/https-www-atlassian-com-blog-a-d6GBD0FhQw2YP6gYLf1MTg
- https://www.atlassian.com/blog/atlassian-engineering/why-we-chose-kafka
Authorization
Airbnb
Over the last couple of years, Airbnb engineering moved from a monolithic Ruby on Rails architecture to a service oriented architecture. In our Rails architecture, we had an API per resource to access the underlying data.
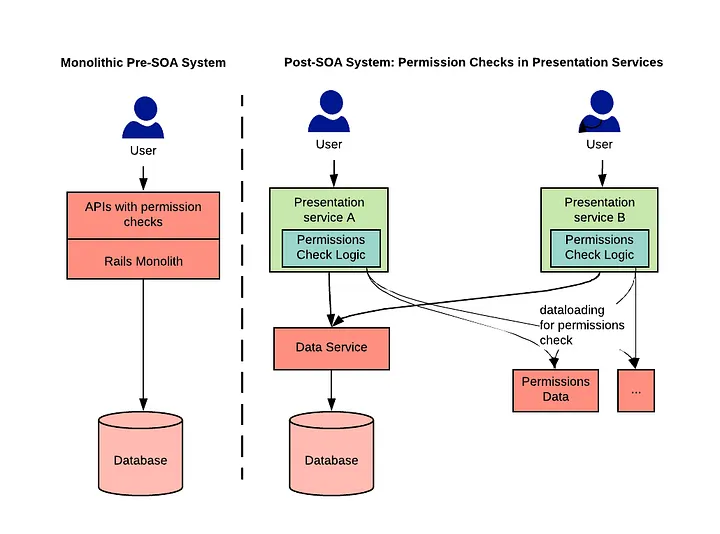
Solution
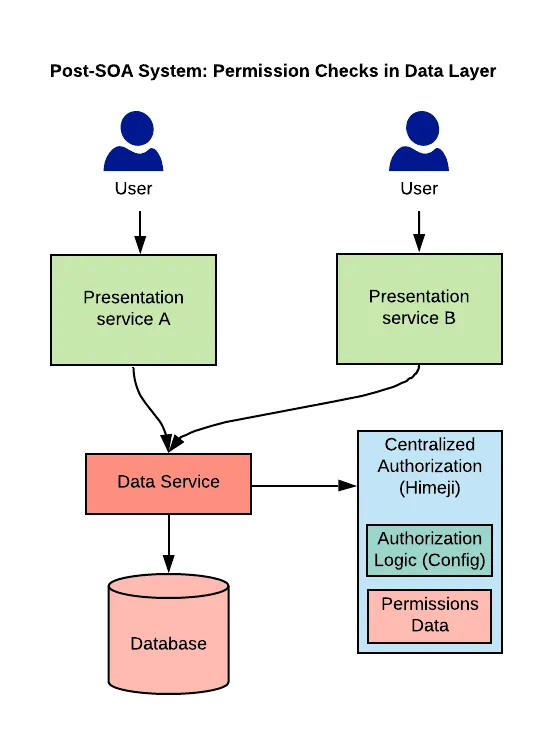
Live Updates Implementation
Data Flow:
- Event Sources: User actions (follows, likes, retweets, replies) generate events
- Business Rules Engine: Applies notification policies, spam filtering, and user preferences
- Priority Queues: Separates traffic into distinct tiers to prevent important events from being blocked
- Message Processor: Routes notifications to appropriate delivery channels
- Delivery Channels: APNS (iOS), FCM (Android), SMS gateways, email services
Key Innovation: Priority Queue System
When a celebrity with millions of followers tweets, the system generates millions of notifications simultaneously. Without prioritization, regular user notifications would queue behind celebrity-related ones, degrading user experience. Twitter solves this through multi-tier priority queues:
- High Priority: Login verification codes, system alerts, important mentions
- Medium Priority: Celebrity tweets, trending content notifications
- Low Priority: Regular recommendations, less urgent updates
This ensures that critical operations (login codes) never block due to celebrity notification spikes. The queue system independently scales each tier based on load.
Live feed
Twitter use fanout write apporach where when user post a tweet it will be write all his followers timilline cache in redis
So each post will write no of followers they have
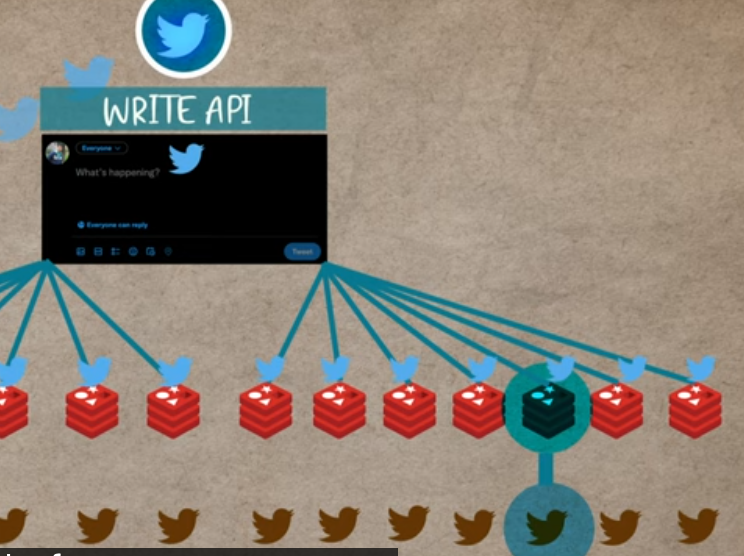
Each user will have redis cache it will be consumed from there but this only for user who has less 1 miilion followers for user who has more then that it will not be written it will be fetch on demand.