
Basic of sound
        Amplitude (Loudness)
          ↑
          │      ---      ---      ---
          │     /   \    /   \    /   \
          │----/-----\--/-----\--/-----\-----
          │  /        \/       \/        \
          │----------------------------------> Time
                        ↑
                 Wavelength (Pitch)
A speaker moves back and forth:
        air
         ↓
Speaker  →  ))))))))))  →  your ear
The speaker pushes and pulls the air. This creates changes in air pressure.
our ear detects those pressure changes, and our brain interprets them as sound.
So, at a very basic level:
Sound is a changing pressure in the air.
We could measure the size of those pressure changes using something like Pascals (Pa).
Sound A → pressure variation = 0.001 Pa
Sound B → pressure variation = 0.01 Pa
Sound C → pressure variation = 0.1 Pa
Human hearing covers a huge range of sound pressure. like up to milion so it hard to measure audio using PA so they introduced the DB
dB does not originally mean “loudness.”
It is a mathematical way of expressing a ratio between two quantities.
For power:
P₂ = the thing we’re measuring.
P₁ = the reference we’re comparing it against.
“How big is this compared with the reference?”
The reference is a standardized very small sound pressure. So:
dB SPL = sound pressure compared with a reference pressure.
dBV
Voltage compared with a reference of 1 volt RMS.
dBu
Voltage compared with approximately 0.775 volts RMS.
dBFS
Digital audio compared with the maximum digital level.
dBFS tells you how loud a digital audio signal is compared with the maximum level your digital system can handle.
   MAXIMUM DIGITAL LEVEL
          ↓
       0 dBFS  ← 🚨 absolute maximum
       ───────────────
      -1 dBFS
      -6 dBFS
     -12 dBFS
     -18 dBFS
     -30 dBFS
     -60 dBFS
- 0 dBFS = the maximum possible digital level
- -6 dBFS = fairly loud, but below the maximum
- -12 dBFS = lower
- -30 dBFS = much lower
Frequency
Frequency refers to how many sound wave cycles occur in one second and is measured in Hertz (Hz). It determines the pitch of the sound.
| Frequency (Hz) | Type of Sound |
|---|---|
| 20 Hz - 60 Hz | Deep Bass (Subwoofer sounds) |
| 60 Hz - 250 Hz | Bass (Kick drum, male voices) |
| 250 Hz - 2 kHz | Midrange (Guitar, piano, speech) |
| 2 kHz - 6 kHz | Upper Midrange (Clarity, presence) |
| 6 kHz - 20 kHz | Treble (Hi-hats, cymbals, airiness) |
| sample rate | |
| The sample rate decides how frequently we “take a snapshot” of the continuous wave. |
Bit rate
Bit Rate refers to how much audio data is processed per second in a digital audio file. It is measured in kilobits per second (kbps).
Bit rate refers to how much data is used to store each sample, and it’s directly related to audio quality.
| Bit Rate | Quality | Usage |
|---|---|---|
| 32 kbps | Very Low | Voice recordings, podcasts |
| 96 kbps | Low | FM Radio quality |
| 128 kbps | Standard | Common for MP3 audio |
| 192 kbps | Good | Decent music quality |
| 256 kbps | High | Used in online streaming |
| 320 kbps | Very High | Studio-quality MP3 |
| Bit Depth (Bits) |
Bit Depth defines the number of bits used to store each audio sample.
bit depth represent the Y axis in the sound where it go from 0 to 65k top
| Bit Depth | Dynamic Range | Use Case |
|---|---|---|
| 8-bit | 48 dB | Old video games, low-quality audio |
| 16-bit | 96 dB | CD-quality audio |
| 24-bit | 144 dB | Studio-quality, professional recordings |
How audio processed and stored
Audio format
μ-law
- μ-law is primarily used in telephony. It compresses a wide dynamic range of audio amplitudes into a smaller, 8-bit range.
- -Logarithmic Compression: It applies a logarithmic curve so that softer sounds get more precision, and louder sounds are compressed.
- Bit Structure: The 8 bits in μ-law typically include:
- Sign Bit: Indicates if the sample is positive or negative.
- Exponent: Scales the value logarithmically.
- Mantissa: Provides finer detail within the range defined by the exponent
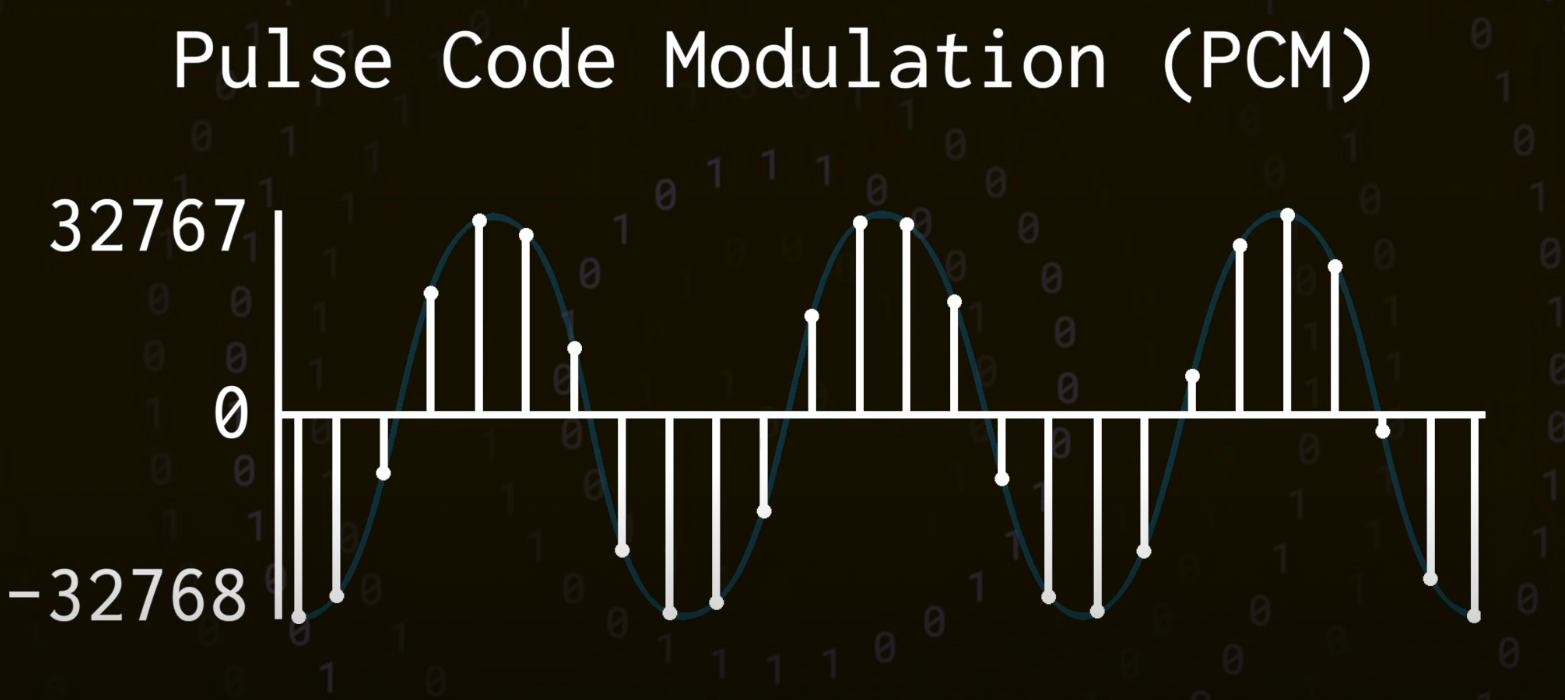
PCM (Pulse Code Modulation)
- PCM is a linear representation of the audio waveform and is widely used in digital audio systems because it maintains the true amplitude of the signal without compression.
- Sampling: The analog signal is sampled at fixed intervals (e.g., 8000 Hz in telephony).
- Quantization: Each sample is quantized to a fixed bit depth (e.g., 16 bits), representing the exact amplitude.
- Storage: The samples are stored as linear numbers (often in little-endian format), ready for processing by systems like speech recognition engines.
-
Above we used 16 bit number to rep the line length which are called bit depth (-32768 to 32767)
-
Each point will be stored each line length will be bit length
Audio Processing & Feature Extraction
Overview
Audio processing is the foundation of all voice-based AI models. Before any machine learning can happen, raw audio must be converted into representations that neural networks can understand and process efficiently.
1. Raw Waveform (Time-Domain) Processing
Concept
This is direct processing of the original audio signal. Audio is treated as a sequence of amplitude values over time.
- Example: 44,100 samples per second in 44.1kHz audio
- No loss of information (everything the mic captured is preserved)
- High-dimensional input → needs large models and lots of compute
Advantages
- Complete information preservation
- Captures subtle acoustic details
- No preprocessing loss
Disadvantages
- Computationally expensive
- Requires large models
- High memory usage
Models Using Raw Waveforms
- Wav2Vec 2.0 (Meta) - Self-supervised representation learning
- Whisper (OpenAI) - Partially uses raw waveforms before converting
- WaveNet (DeepMind) - For TTS generation
2. Frequency-Domain Processing
Concept
Instead of using raw audio samples, we convert the waveform into the frequency spectrum using techniques like Fourier Transform.
The key insight: Audio is easier to work with when decomposed into its frequency components.
Processing Steps
- Take raw waveform
- Apply Fourier Transform (or Short-Time Fourier Transform)
- Get frequency information
- Optionally transform to human-perceptual scale (Mel)
- Convert to image-like format for neural networks
Spectrogram
A spectrogram is a visual representation of the spectrum of frequencies in a signal as they vary with time.
- X-axis: Time
- Y-axis: Frequency
- Color intensity: Amplitude/Energy at that frequency-time point
- Creates a 2D image from 1D audio signal
Mel Spectrogram
A Mel Spectrogram applies the Mel scale, which models how the human ear perceives frequencies (we’re better at distinguishing differences in lower frequencies than higher ones).
- Maps frequency scale to mel scale (human perception)
- Reduces dimensions while preserving important perceptual information
- More efficient than raw spectrogram for speech tasks
- Standard choice for TTS and ASR models
MFCC (Mel-Frequency Cepstral Coefficients)
MFCCs are a compact, hand-engineered feature set originally designed for speech processing:
- Derived from Mel spectrograms
- Further compressed using cepstral analysis
- Historically used in traditional speech models
- Still useful for small embedded systems
- Being replaced by learned representations in modern models
Advantages of Frequency-Domain Processing
- Reduced dimensionality (44,100 samples → ~100 frames)
- Aligns with human hearing perception
- Efficient for neural networks
- Works great with CNNs (2D grids like images)
Models Using Frequency-Domain
- Whisper (OpenAI) - Converts raw waveform → log-mel spectrogram
- Tacotron (TTS) - Uses mel spectrograms
- DeepSpeech - Uses MFCC-like features
3. Convolutional Neural Networks (CNN) for Audio
Why CNNs for Audio?
CNNs are specialized neural networks that:
- Detect patterns like edges, curves, textures
- Work best with grid-like data (images, spectrograms)
- Use filters (also called kernels) to slide over the input and extract local features
Audio as Images
When we convert audio into a 2D spectrogram, it becomes like an image:
- X-axis: Time
- Y-axis: Frequency
- Pixel Intensity: Energy at that time-frequency point
So CNNs can analyze patterns across time and frequency, just like they detect features in images.
CNN Architecture for Audio
Raw Audio Waveform
    ↓
Mel Spectrogram (2D grid)
    ↓
CNN Layers (Convolutions)
    ├─ Conv1: Detect basic patterns (pitch, texture)
    ├─ Conv2: Detect mid-level patterns (phonemes)
    ├─ Conv3: Detect high-level patterns (words, context)
    ↓
Feature Maps
    ↓
Fully Connected / Attention Layers
    ↓
Output (Classification, Transcription, etc.)
Key Concepts
- Local Connectivity: Convolutional filters only look at local regions, capturing patterns like “this frequency jumped at this time”
- Parameter Sharing: Same filter applied everywhere, learning general patterns
- Hierarchical Feature Learning: Early layers find simple patterns, later layers find complex patterns
4. Noise Cancellation & Denoising
Problem
Real-world audio contains background noise:
- Ambient noise
- Microphone noise
- Interference from other speakers
Noise Cancellation Models
Models designed to separate speech from noise in audio:
| Model | Parameters | RTF (CPU) | Architecture | Quality (PESQ) |
|---|---|---|---|---|
| RNNoise | 0.06M | 0.03 | GRU + DSP Hybrid | 2.33 |
| DeepFilterNet2 | 2.31M | 0.04 | Two-stage ERB | 3.08 |
| SpeechBrain SepFormer | 22.3M | ~0.15 | Transformer-based | 3.15 |
| Facebook Denoiser | 60.8M | 0.8 | U-Net Encoder-Decoder | 3.07 |
What is RTF (Real-Time Factor)?
RTF measures how fast a model runs relative to audio duration:
- RTF = 0.03 means the model processes 1 hour of audio in ~1.8 minutes
- RTF = 0.8 means the model processes 1 hour of audio in ~48 minutes
- Lower RTF = Faster = Better for real-time applications
How Denoising Works
- Input: Noisy audio waveform
- Analysis: Split into frequency bands or time frames
- Feature Extraction: Compute statistics of noise and signal
- Separation: Isolate speech from noise (using learned patterns or signal processing)
- Synthesis: Reconstruct clean speech
- Output: Denoised waveform
Denoising Techniques
- Spectral Subtraction: Subtract estimated noise spectrum from signal
- Wiener Filtering: Apply adaptive filter based on signal-to-noise ratio
- Deep Learning: Train neural networks to discriminate speech from noise
- Source Separation: Decompose audio into separate sources (speech, music, noise)
5. Complete Audio Processing Pipeline (Example)
Whisper’s Approach
Whisper (OpenAI) is a good reference for a complete pipeline:
Audio File (MP3, WAV, etc.)
    ↓
[Decoding] → Raw PCM waveform (16kHz sampling)
    ↓
[Windowing] → Frames (~20ms each with overlapping windows)
    ↓
[FFT] → Frequency representation for each frame
    ↓
[Mel Scale] → Map to mel scale (human perception)
    ↓
[Log Scale] → Apply log compression (normalize amplitude)
    ↓
[Normalization] → Standardize values (mean=0, std=1)
    ↓
[Output] → Log-mel spectrogram (80 frequencies × time steps)
    ↓
Input to Speech Model (Transformer Encoder)
MFCC Extraction Example
Audio Signal
    ↓
[Pre-emphasis] → Boost high frequencies
    ↓
[Windowing] → Apply window function (Hamming)
    ↓
[FFT] → Frequency spectrum
    ↓
[Mel Filter Bank] → Apply 40 overlapping triangular filters
    ↓
[Log Energy] → Take log of filter outputs
    ↓
[DCT] → Discrete Cosine Transform
    ↓
[Output] → 13 MFCC coefficients + derivatives
    ↓
Input to Speech Model (RNN, SVM, etc.)
6. Feature Extraction Concepts
Short-Time Fourier Transform (STFT)
Used to analyze frequency content of signals that vary over time:
- Divides audio into short overlapping windows
- Applies FFT to each window
- Produces time-frequency representation
- Foundation for spectrograms
Zero Crossing Rate (ZCR)
Counts how many times the audio signal crosses the zero amplitude line:
- High ZCR → High-frequency content (consonants, fricatives)
- Low ZCR → Low-frequency content (vowels)
- Used in VAD (voice activity detection)
Short-Time Energy (STE)
Measure of energy/power in a window of audio:
- Speech has higher energy than silence
- Useful for speech detection
- Sensitive to volume changes
Spectral Centroid
Center of mass of the frequency spectrum:
- High value → Bright, high-frequency sound
- Low value → Dark, low-frequency sound
- Useful for speech/music classification
Key Takeaways
- Raw waveform processing preserves all information but is computationally expensive
- Frequency-domain processing (mel spectrograms) is the standard for modern speech models
- CNNs are effective for analyzing spectrograms as 2D images
- Noise cancellation is often a preprocessing step
- Different tasks benefit from different feature representations