
├── Calculus
│   ├── Functions
│   ├── Limits
│   ├── Derivatives
│   │   ├── Partial Derivatives
│   │   ├── Gradients
│   │   ├── Jacobian
│   │   └── Directional Derivative
│   ├── Chain Rule
│   ├── Taylor Expansion
│   ├── Hessian Matrix
│   ├── Integrals
│   │   ├── Definite Integrals
│   │   ├── Multiple Integrals
│   │   └── Integration by Parts
│   ├── Multivariable Calculus
│   │   ├── Divergence
│   │   └── Laplacian
│   └── Automatic Differentiation
│       ├── Forward Mode
│       └── Reverse Mode (Backprop)
Slope
Mathematically, slope means “steepness of a line.”
the slope is:
This formula is basically:
which is often called rise over run.
Slope isn’t just math scribbles it describes how fast one thing changes compared to another.
-
Economics: The slope of a cost graph tells you how much cost increases per unit of product.
-
Physics / Motion: If time is on the x-axis and distance is on the y-axis, the slope tells you speed. Example: slope = 60 means 60 km per hour.
-
Geography: Slope of a hill = how steep the hill is. A slope of 0.5 means every 1 meter forward, you climb 0.5 meters up.
-
Data Science / Trends: If sales are graphed vs. time, the slope tells you how quickly sales are increasing or decreasing.
So slope = rate of change. It answers: “For every unit I move in x, how much does y change?”
Limits
Slope of a line (constant slope) For a straight line, slope is easy:
That number never changes no matter which two points you pick. Example: line always has slope 2.
The problem: curves (slope not constant)
Real life is not straight.
- Speed changes when you press the accelerator.
- Business profit doesn’t grow in a straight line.
- A hill is steeper in some places, flatter in others.
So asking “what’s the slope of a curve?” is tricky. If you pick two points, you only get the average slope between them, not the instant slope at one exact point.
Example:
- Between and , slope = .
- Between and , slope = .
See? It keeps changing.
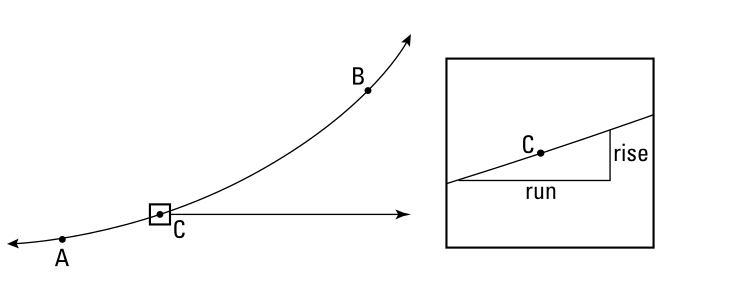
The idea: zoom in infinitely
The genius of calculus is this thought:
If slope changes, what if we zoom in on the curve so much that it looks like a straight line?
At any tiny point, a curve looks like a line. That line is called the tangent line.
The slope of that tangent = slope of the curve at that exact point.
How do we calculate it? (Limits)
We take two points very close to each other and compute slope:
where is a tiny step.
Now, we shrink closer and closer to zero (but never actually zero — otherwise we’d divide by zero).
That shrinking process is called a limit:
This is the derivative.
NOTE: Derivative is just a equation we find slope at any point just plug in vaule
What is ?
The notation is called a derivative. It represents the rate of change of a function with respect to the variable .
- is some function of , i.e., .
- is the independent variable, and is the dependent variable.
So, tells you how much changes when changes by a small amount.
What Does It Mean Practically?
Imagine you’re driving a car, and is the time and is the distance you’ve traveled. The derivative represents the speed of the car how fast the distance changes as time changes.
-
If , it means that for every 1 unit of time, the distance increases by 10 units (i.e., your speed is 10 units per time).
-
If , it means you’re not moving — the distance isn’t changing as time goes on.
Differentiation Rules
1. Power Rule
then
Examples:
2. Constant Rule
(any constant has zero slope).
Example: .
3. Constant Multiple Rule
Example:
.
4. Sum and Difference Rule
Example:
.
5. Product Rule
When multiplying two functions:
Example:
.
Why: slope of a product involves change in both factors.
6. Quotient Rule
For division:
Example:
.
7. Chain Rule (very important!)
If one function is inside another:
Example:
Let’s say we making a cup of coffee, and there’s a machine that automatically heats up water for you. The speed at which the temperature of the water changes depends on how much you’ve turned the knob on the coffee machine. The knob controls the heating power.
Step 1: Breaking Down the Process
- The knob setting (denote it as ) affects the heating power (denote this as ), i.e., how strong the heat is.
- The heating power affects the rate of temperature change in the water (denote the rate of temperature change as , where is the temperature and is time).
- Finally, the rate of temperature change affects how quickly the water’s temperature increases, which is what you’re interested in.
Step 2: Putting It Together
we can think of this situation as a chain of functions. The heating power depends on the knob setting, and the temperature change depends on the heating power. This is why it’s a composite function (one function inside another).
So we have:
- The rate of temperature change depends on the heating power, which in turn depends on the knob setting.
Now, we apply the chain rule to express this relationship. Here’s how it looks:
-
: This is how the temperature changes with heating power. It tells you how fast the temperature increases for a given amount of heating power.
-
: This is how the heating power changes with the knob setting. It tells you how much the heating power increases when you turn the knob.
8. Derivatives of common functions
Partial derviative
What is a Function of Two Variables?
So far, you’ve seen functions like
- Input: one variable (x)
- Output: one variable (y)
Example:
Now, with two variables, the function looks like:
- Input: two variables (x and y)
- Output: one variable (z)
Example:
- Think of and as coordinates on a flat floor (2D plane).
- Then tells you the height above that floor.
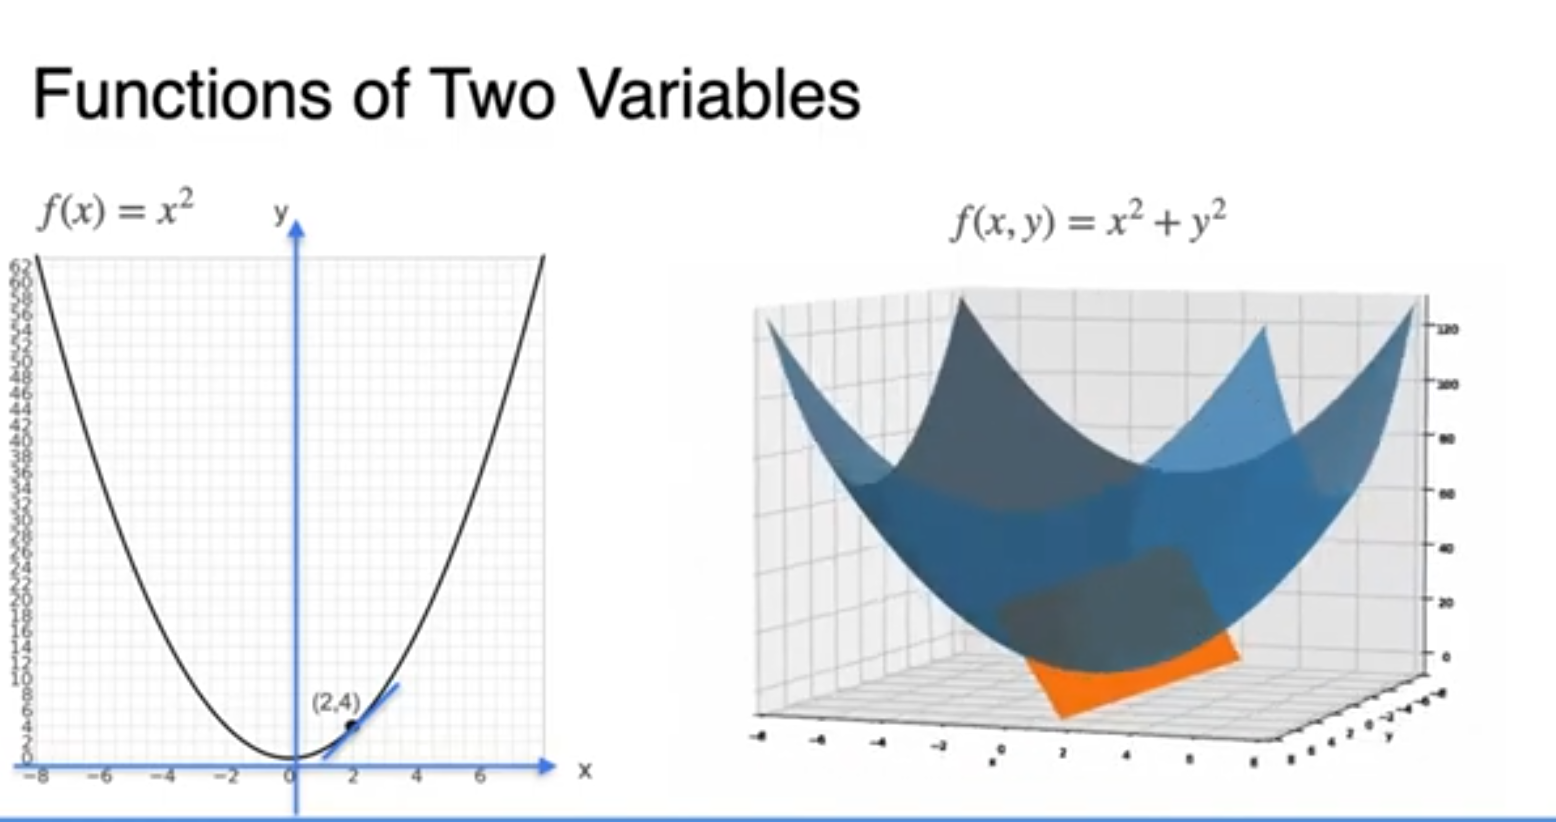 So the graph of a two-variable function is a surface in 3D space.
Example:
- is a “paraboloid bowl” like a satellite dish.
In single-variable calculus: slope = “how much y changes when x changes.” But here we have two directions of change:
- Change in (keeping fixed)
- Change in (keeping fixed)
That’s why we use partial derivatives. Example: If
- Partial derivative w.r.t. :
- Partial derivative w.r.t. :
These measure slope in each direction.
-
= slope of the surface if you walk in the x-direction.
-
= slope if you walk in the y-direction.
So calculus in two variables is like studying the shape of a mountain surface slopes in different directions, steepest ascent, valleys, saddles.
Preceptron
We have a model with preceptron of
y hat is the output to find the loss we use loss mean square
which is
Goal: Adjust so that predictions get close to true values .
For that we need to find how much output y cap is depends or change based on w1,w2, and bias so we need calclus here below things we need
How much Loss change based on bias etc
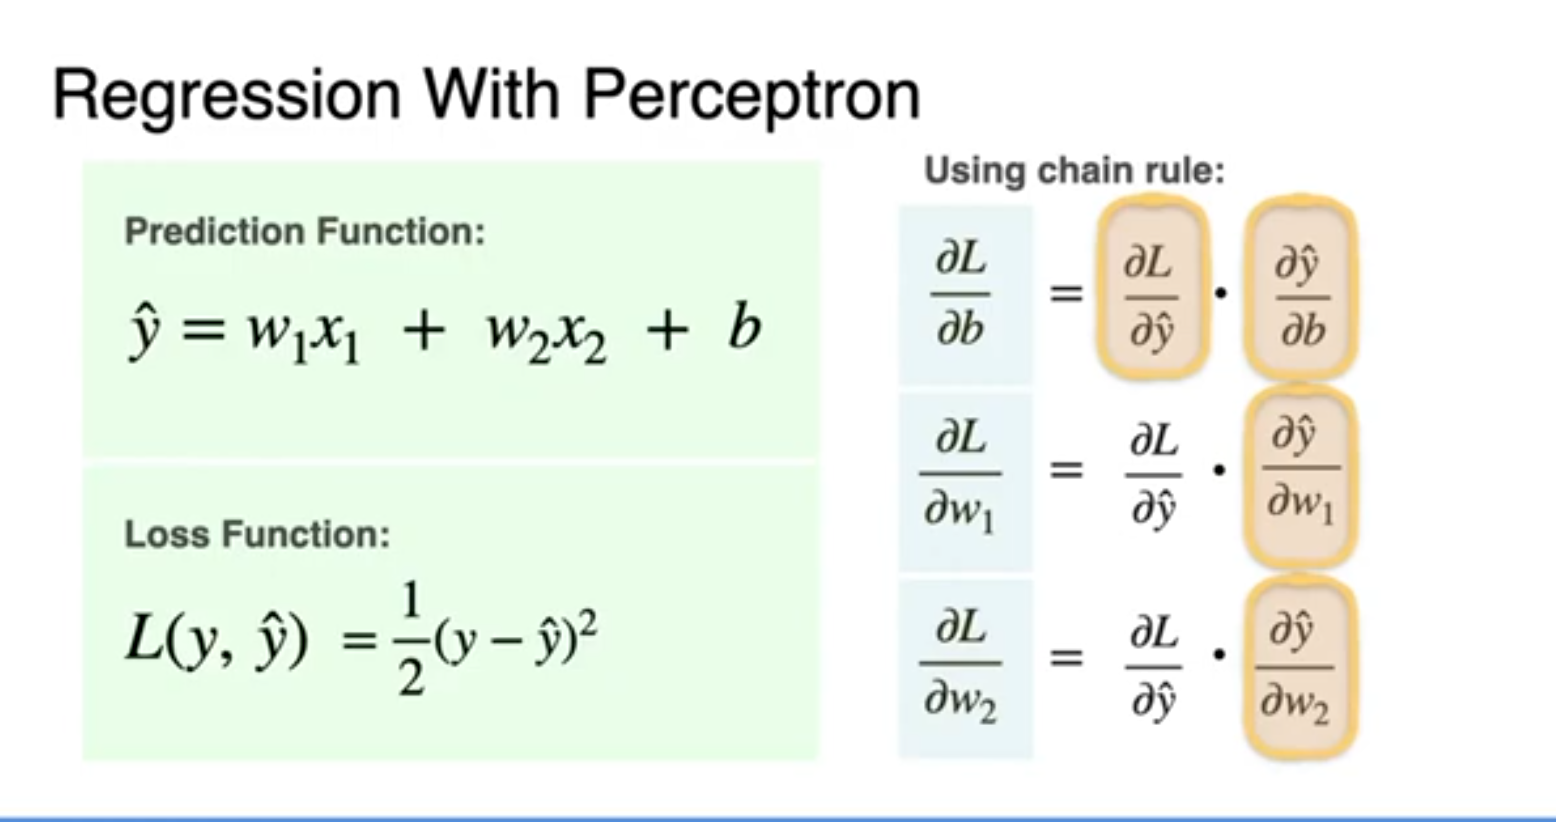
Problem: The loss is not a direct function of .
It’s hidden inside layers:
This is a composition of functions.
So we use the chain rule:
To find dl/dy cap Where u is $$ (y - \hat{y})
So **L** depends on **u**, and **u** depends on **y** That means: **L** depends on **y** **through** **u** Suppose we nudge $y$ by a tiny amount $\Delta y$. That changes $u$ by:\Delta u \approx \frac{du}{dy} \cdot \Delta y
Then that change in $u$ changes $L$:\Delta L \approx \frac{dL}{du} \cdot \Delta u
Now substitute the first relation ($\Delta u$):\Delta L \approx \frac{dL}{du} \cdot \frac{du}{dy} \cdot \Delta y
Divide both sides by $\Delta y$:\frac{\Delta L}{\Delta y} \approx \frac{dL}{du} \cdot \frac{du}{dy}
As $\Delta y \to 0$:\frac{dL}{dy} = \frac{dL}{du} \cdot \frac{du}{dy}
L = (u)^2, \quad u = 3y
L = (3y)^2 = 9y
\frac{dL}{dy} = 18y
\frac{dL}{du} = 2u, \quad \frac{du}{dy} = 3
\frac{dL}{dy} = (2u)(3) = 6u
Now plug $u=3y$:\frac{dL}{dy} = 6(3y) = 18y
\frac{dL}{dy} = \frac{dL}{du}\cdot\frac{du}{dy}