
Distributed Tracing helps track requests as they flow across multiple microservices in a distributed system.
Each service adds trace information so you can reconstruct the full request path, timing, and dependencies.
Key Tools & Standards
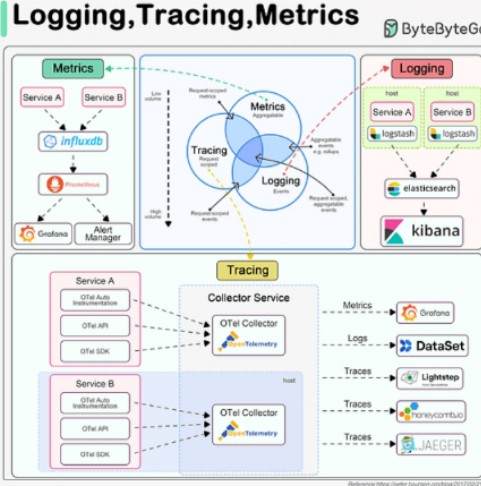
OpenTelemetry (OTel)
A standardized framework for collecting telemetry data (traces, metrics, logs, and events) across distributed systems.
Core Components
- Instruments → Language-specific libraries that capture telemetry data (traces, metrics, logs, profiling).
- Collector → A single binary that receives, processes, and exports telemetry data.
- Specification → Defines APIs and SDKs for consistent implementation.
- SDK Components
- Instrumentation → Collects traces from your code (e.g., Express instrumentation). 🔗 Registry of instrumentations
- Processors → Receive spans and apply transformations. Examples: SimpleSpanProcessor, BatchSpanProcessor.
- Exporters → Send processed data to backends (e.g., Zipkin, Jaeger, OTLP, Prometheus).
- Propagators → Inject and extract context across service boundaries using trace headers.
Telemetry Data Types
| Type | Common Tools |
|---|---|
| Traces | Zipkin, Jaeger |
| Metrics | Prometheus |
| Logs | Grafana Loki, Promtail, Fluent Bit |
| Events | k-span |
📺 Resources
- 📘 Getting Started with OpenTelemetry (Docs)
- 🎓 OpenTelemetry Bootcamp (YouTube Playlist)
- ▶️ Intro Video
Distributed Tracing Tools
Zipkin
Zipkin Components
- Collector → Gathers trace data from instrumented services.
- Storage → Persists trace data for analysis.
- API → Enables querying and retrieving trace data.
- Web UI → Visualizes trace spans and dependencies.
Jaeger
🔗 https://www.jaegertracing.io/
Alternative to Zipkin with similar distributed tracing capabilities.
Trace Context Propagation
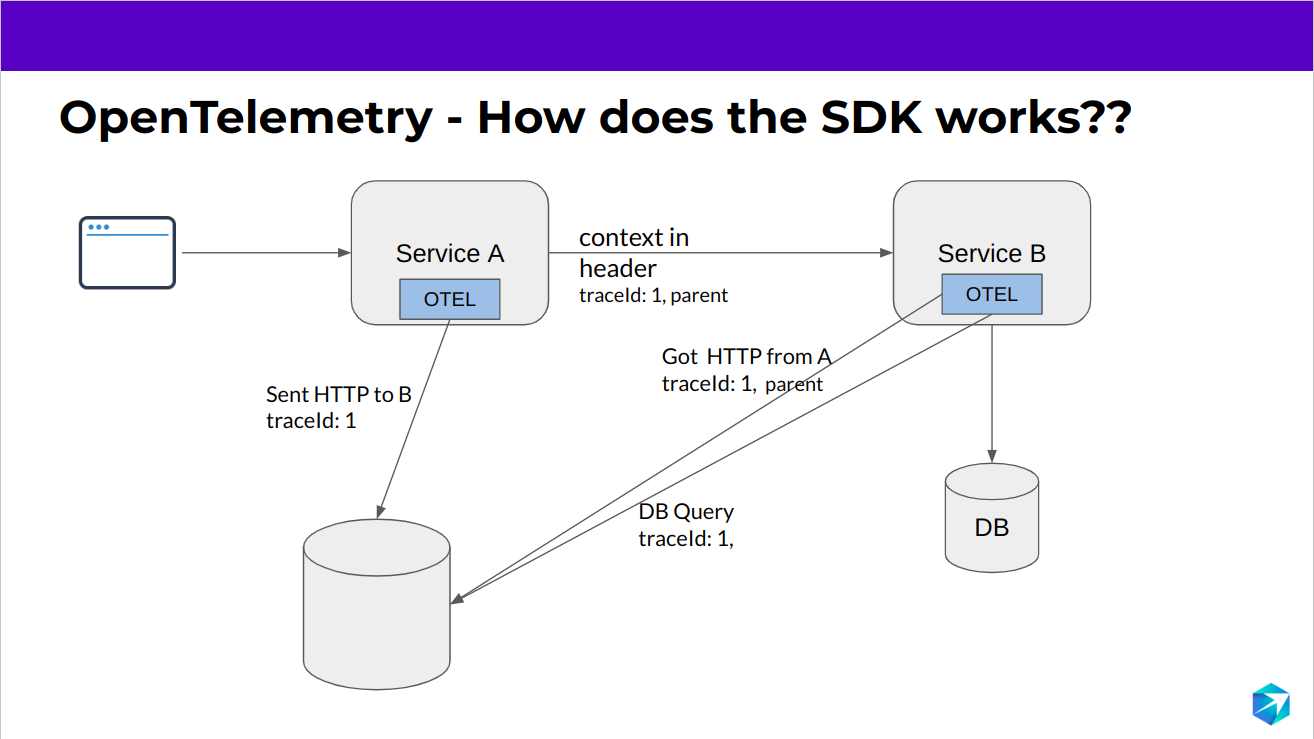
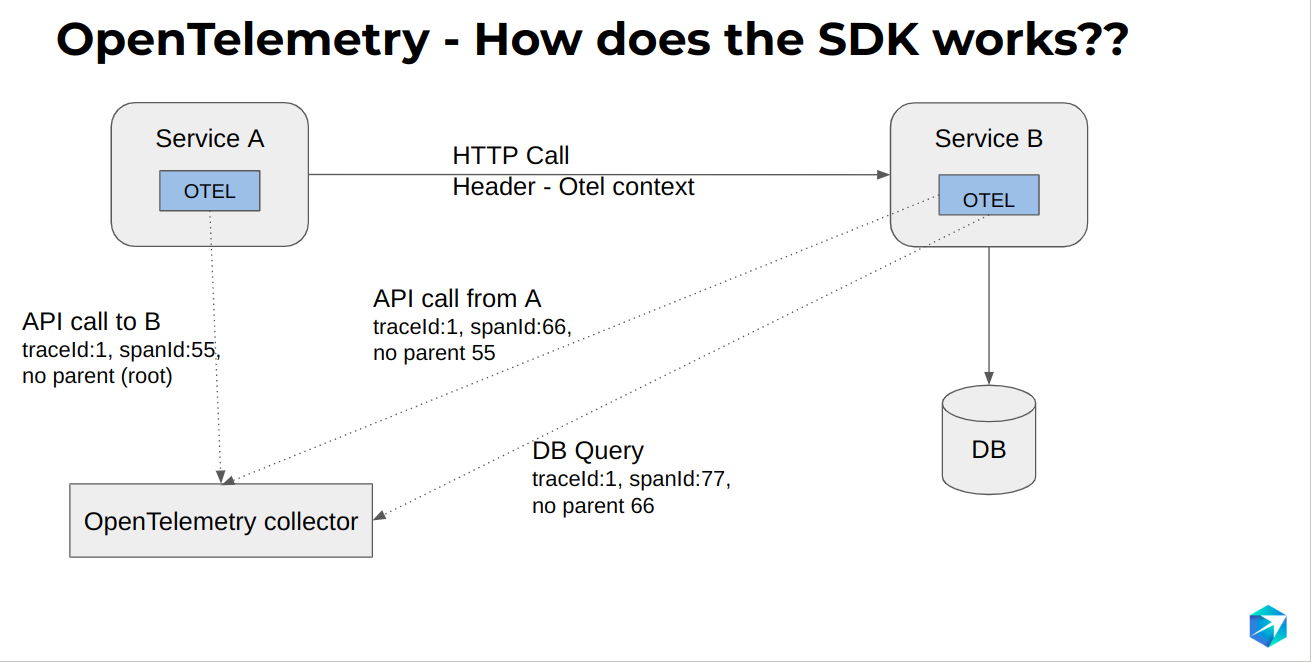
When Service A calls Service B:
- Service A attaches a trace ID and parent span ID to the request header.
- Service B receives it and informs OpenTelemetry SDK that it’s part of the same trace context.
- This creates a unified trace across all services.
Observability Tools & Platforms
| Category | Product | Description / Link |
|---|---|---|
| Monitoring & Observability Suite | Sematext | Full-stack monitoring tools for DevOps teams to track logs, metrics, and traces. |
| Kernel-Level Tracing | eBPF Tracing (Groundcover Blog) | Tracing at the kernel level using eBPF for deep visibility. |
| Observability Blog & Tools | Groundcover Observability Tools | Overview of observability tools and comparisons. |
| Observability Resource Hub | Groundcover Blog | Regularly updated observability insights. |
| Awesome Observability List | GitHub: adriannovegil/awesome-observability | Curated collection of observability best practices, tools, and guides. |
Learning & Reference Material
- Book: Distributed Systems Observability
- Google SRE Book Collection: https://sre.google/books/
- Related Note: Tracing (Notion link)
Data Flow in Distributed Tracing
- Instrumentation collects trace data →
- Propagator attaches context headers →
- Collector receives data →
- Processor batches or modifies it →
- Exporter sends it to backend (e.g., Zipkin/Jaeger) →
- UI visualizes full trace flow across services.
Case Study
-
Building Netflix’s Distributed Tracing Infrastructure : Netflix built its tracing system using Jaeger and ELK (Elasticsearch, Logstash, Kibana) for storage and visualization.
-
Telltale: Netflix Application Monitoring Simplified: Describes Telltale, Netflix’s in-house monitoring platform for large-scale systems.
-
Edgar: Solving Mysteries Faster with Observability: Edgar is a self-service observability and troubleshooting tool built by Netflix for distributed systems.
-
End-to-End Tracing at Canva: Canva implemented distributed tracing by wrapping OpenTelemetry and building a custom tracing layer tailored to their infrastructure.
-
Distributed Tracing — We’ve Been Doing It Wrong: Explores the limitations of traditional tracing approaches and discusses alternative models and design philosophies for distributed observability.
Distributed tracing tool
https://www.groundcover.com/blog/ebpf-tracing → to trace in kernel level
https://github.com/adriannovegil/awesome-observability#1-best-practices
Products
- https://sematext.com/ [We provide monitoring tools for DevOps teams that want to move faster provide A to Z monitoring]
https://www.groundcover.com/blog/observability-tools
Obervablity related blog → https://www.groundcover.com/blog
https://github.com/adriannovegil/awesome-observability no
Book → Distributed Systems Observability
https://sre.google/books/ collection of book
Open telemetry → standard for tracing, logs the distributed system
- Traces → Zipkin
- metrics → Prometheus
- logs → grafan loki, promtel,flynn bit
- Events → k-span
Components of Open telemetry
- Instruments → library for each programming language to capture → traces metrics logs and profiling
- collector → single bin to receive process and export data →
- specification → API SDK
https://youtu.be/Txe4ji4EDUA → get started video
-
Zipkin
Zipkin Components: Zipkin consists of several components:
- Collector: Collects trace data from instrumented services and stores it.
- Storage: Stores the collected trace data for later analysis.
- API: Provides a query API for retrieving and analyzing trace data.
- Web UI: Offers a user interface to visualize and analyze traces.
https://www.jaegertracing.io/ → Zipkin alternative
When service to service request go it insert a traceID 1. parent in header when service b recevied it inform to open telementry i recevied request from this trace id
SDK
- instrumentation → which trace collect from the code example → express instrumentation
- https://opentelemetry.io/ecosystem/registry/ [Search te instrumention]
- Processors → receive span and do change ex→ simple span processor, batch, multiple
- Exporter → send data to storage → elastic search etc.. ex →zipkin jager OTLP exporter Prometheus
- Propagator → inject context on outgoing/incoming activities using trace → header
- Learning resource Open telementry